Technical Analysis: Important Price Patterns Every Crypto Investor Should Know
Technical analysis for crypto – the basics
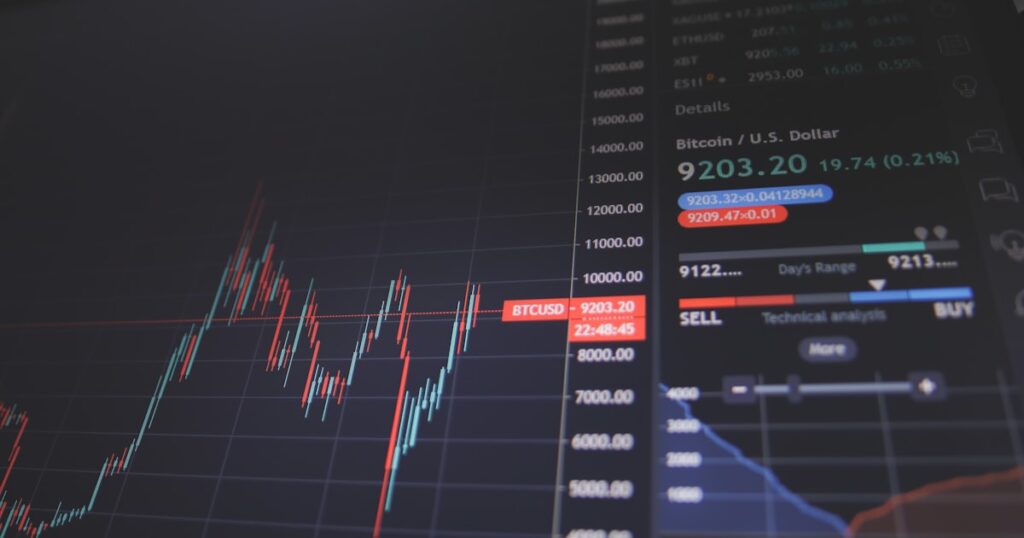
Technical analysis is an essential tool for every crypto trader and investor. Understanding basic price patterns can help identify opportunities and manage risks better.
Thank you for reading this post, don't forget to subscribe!Head & Shoulders pattern
A classic inversion pattern consisting of three peaks – the middle peak (the head) is higher than the two lateral ones (the shoulders). A break below the neckline indicates a transition to a downtrend.
Triangles
Ascending, descending and symmetrical triangles are continuation or reversal patterns. The direction of the breakout determines the next trend.
Support and Resistance
Price levels where demand (support) or supply (resistance) are particularly strong. Identifying these levels is the basis of any trading strategy.
Moving Averages
Simple Moving Averages (SMA) and Exponential Moving Averages (EMA) help identify trends and entry/exit points. The crossing of averages (Golden Cross / Death Cross) is an important trade mark.
RSI Index
The Relative Strength Index (RSI) measures whether an asset is overbought (above 70) or oversold (below 30). An important tool for scheduling transactions.
Open your MEXC digital wallet and get exclusive deposit bonuses. Over 1,700 digital currencies available!
🔗 Open a Free MEXC AccountAffiliate link • Sign up in seconds